When strategy meets reality, the question is simple: can we actually do the work?
These two Portfoleon boards help you answer that – not just with data, but through conversation.
-
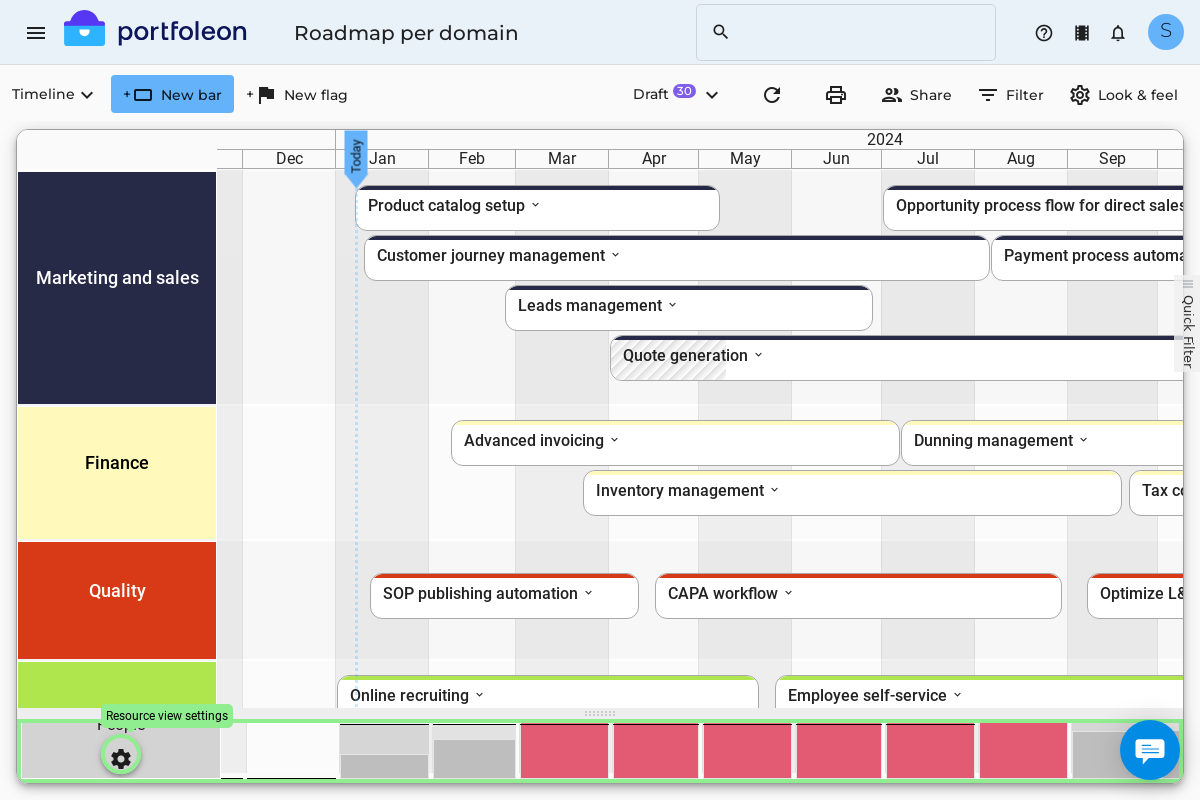
A timeline with resource viewer to show planned work across time and people
-
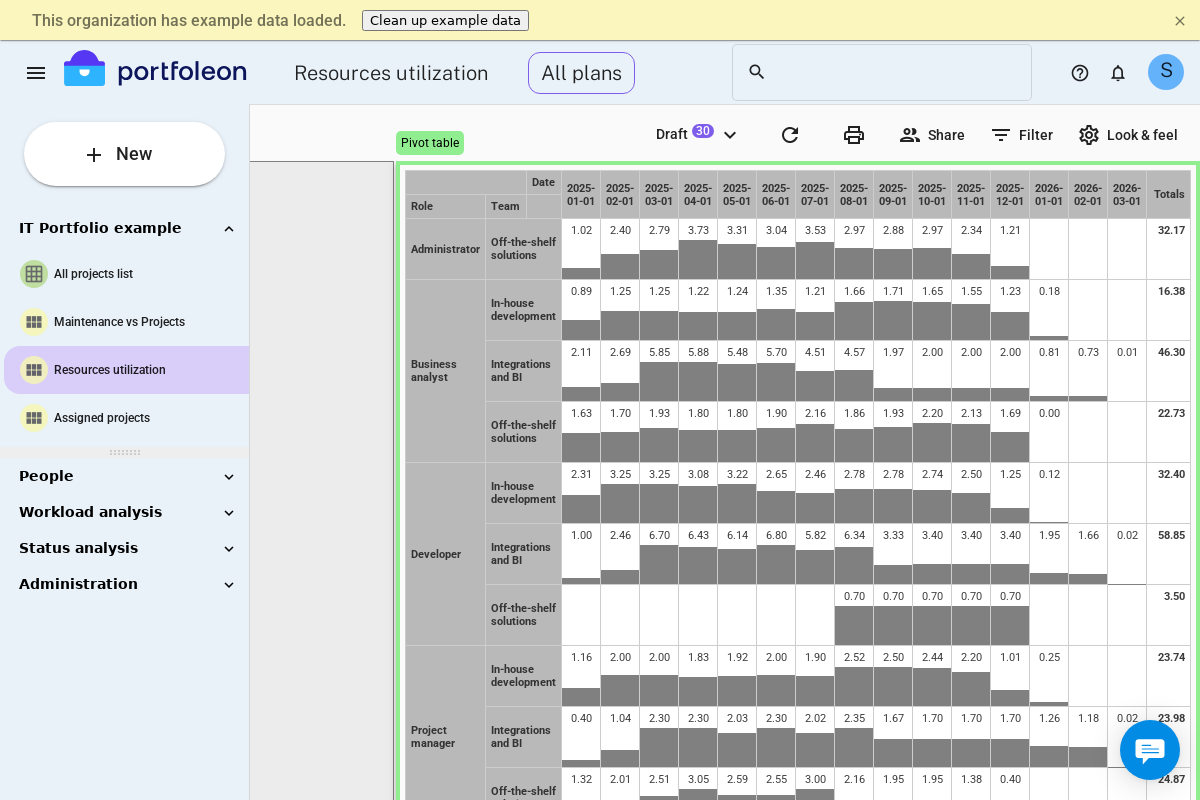
A pivot board with heatmap or bar chart to highlight overloads
These boards will enable the conversation participants to spot bottlenecks and immediately drill down to the data necessary to make a decision.
Boards are for conversations, not just observation. Portfoleon boards work best when they’re shared – with your team, your peers, your leadership. Use boards in meetings, invite others in.
Strategy isn’t something you “monitor” alone, it’s something you do together.
Conversations about feasibility and bottlenecks are often tactical – but they have strategic consequences.
They require:
- Good analysis to reveal where constraints lie
- Creative thinking to generate options
- And decisiveness to commit to a plan
Make sure the right people are in the room. Often, solving bottlenecks isn’t just about hiring or delaying work. Strong options might include:
- 🚩 More aggressive prioritization
- Reducing scope
- 🚩 Make vs. buy vs. partner decisions
- Temporarily shifting people or reordering delivery
🛠 How to Build These Boards
Timeline with Resource Viewer
This board will help you spot pinch points quickly.
-
Create a timeline board
-
In the
Look & Feelmenu select theShow human resourcesoption -
Optionally, filter by roles, teams, or locations by clicking the gear icon in the
Peopleblock below the timeline.
Pivot Table with Heatmap
This board will help you understand the nature of a bottleneck and create viable options.
-
Create a pivot table board
-
Group rows by
Name(this will be your project / initiative name), andPerson -
Group columns by
Date -
Select the
Heatmapview to see the relative load of your team.
With both boards ready, you’ll be equipped for a fast, informed, and collaborative feasibility conversation.